ASA Ag Hackathon Workshop Series:
Volumetric Water Content
Note
The content below was partially based on the Crop-CASMA presentation and other related resources.
Introduction
Tracking crop condition and soil moisture content throughout the growing season can be important tools to:
- Predict crop yields
- Assess/predict levels of soil water content and its effects on crops
- Predict droughts/floods
Introduction
However, measuring these conditions (crop and soil water) can be labor and cost-intensive especially at larger scales such as an entire country.
Due to that need, USDA and NASA worked together to launch 2 satellite missions to address this need.
USDA/NASA Crop Condition and Soil Moisture Analytics Tool (Crop-CASMA)
Crop-CASMA is a web-based geospatial application:
Designed to facilitate the utilization of the remotely sensed geospatial vegetation index and soil moisture data
Data derived from Moderate Resolution Imaging Spectroradiometer (MODIS) and NASA Soil Moisture Active Passive (SMAP) missions
Designed to assess conterminous U.S. crop vegetation and soil moisture conditions
Check the interactive map
For this workshop, we will focus on SMAP.
NASA Soil Moisture Active Passive (SMAP)
NASA SMAP measures soil moisture from the top 5cm of the soil column
SMAP Level-4 datasets assimilate SMAP observations into physically-based numerical models of the land surface water, energy, and carbon cycles
Check this 3-min video for a quick intro to SMAP.
SMAP products
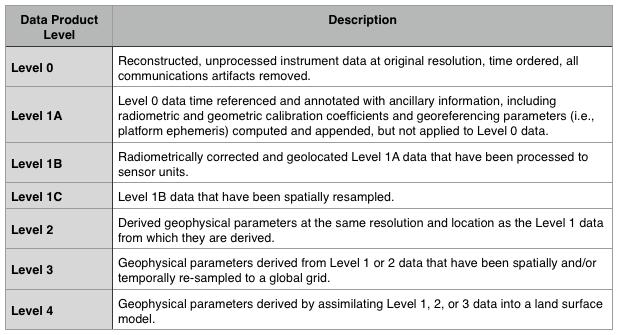
There are 7 data product levels depending on processing stage:

Note
We will focus on Level 4 data only.
SMAP Level 4 products
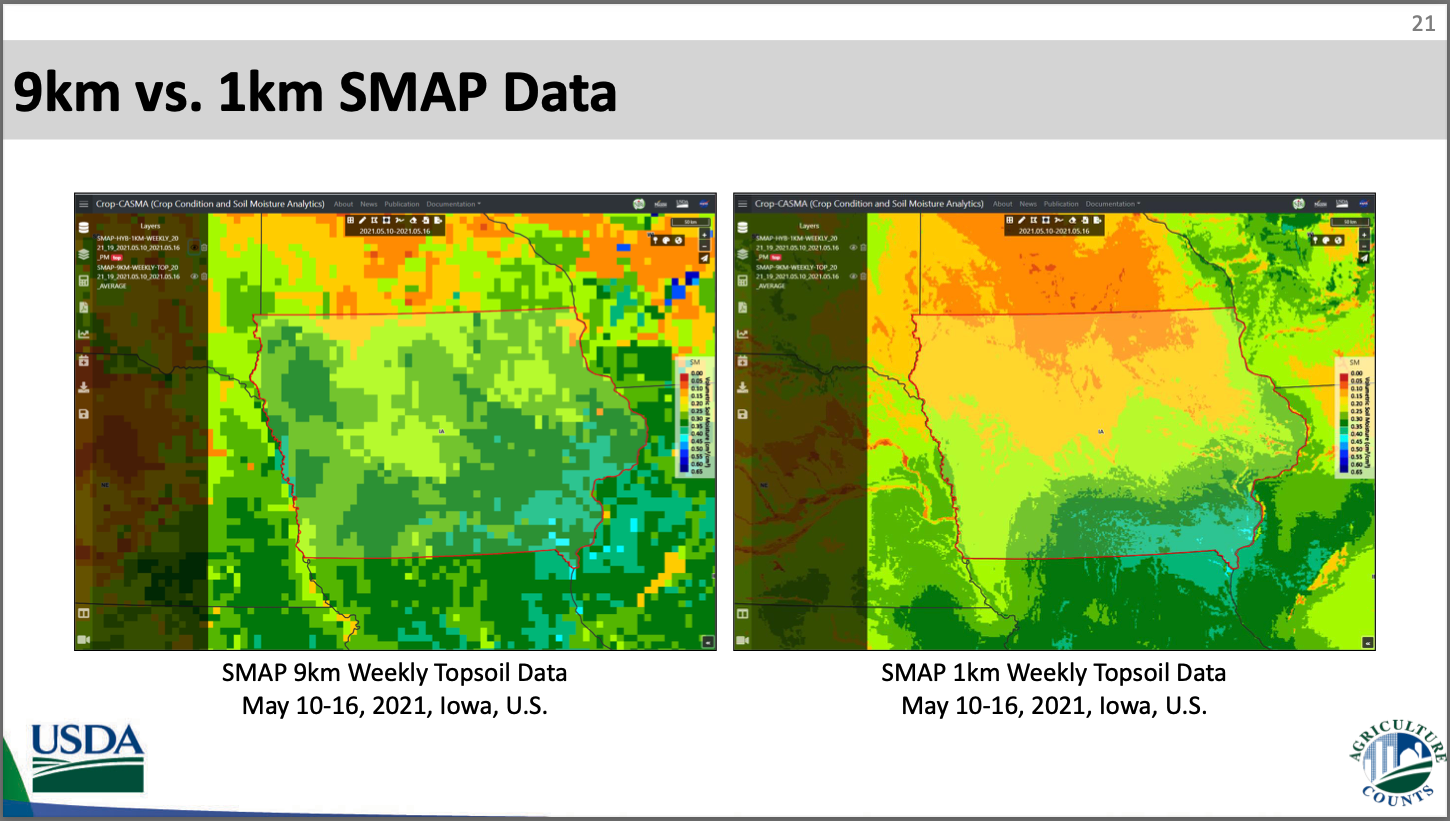
Even just within level 4 products, there are lots of variables!
They vary based on:
- Variable of interest:
- Volumetric water content
- Soil moisture anomaly
- Soil moisture condition (categorical)
- Volumetric water content
- Spatial resolution:
- 1 km
- 9 km
- 1 km
SMAP Level 4 products
Even just within level 4 products, there are lots of variables!
They vary based on:
- Spatial extent (soil depth):
- top soil (top 5 cm)
- sub soil (top 100 cm)
- top soil (top 5 cm)
- Temporal resolution:
- Every 3 hours
- Daily
- Every 3 days
- Weekly
- Multi-year average
- Every 3 hours
- For a list of all level 4 products, check this resource.
SMAP Level 4 products

SMAP validation
SMAP-derived data is validated through a network of soil moisture sensing stations across the USA.

- For more information on how SMAP products are derived and how they are validated, check the full paper here.
Resources
Let’s code!
Although we could access this data base using the interactive map, a more reproducible and automated way of doing it is through coding.
Let’s shift to the coding part of this workshop by downloading this GitHub repository.